
Features ČHMÚ+
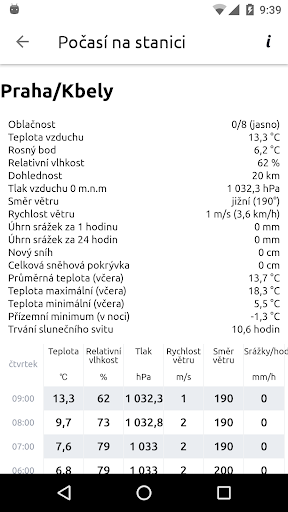
Czech Hydrometeorological + application includes: Weather for professional weather stations There are measured data from dozens of stations located in the Czech Republic.On the map, you can find review show selected data: temperature, precipitation, wind, cloudiness, relative humidity, snow cover and weather conditions.
In detail, the selected station displays a large amount of data and of selected data and its history after hours in the last two days.
Estimated rainfall Estimation of rainfall is generated from the Czech Hydrometeorological Institute radar data corrected according to data from rain gauges at the stations.
Gives the most accurate possible information on the amount of rainfall.
There is an animation for the Czech Republic.
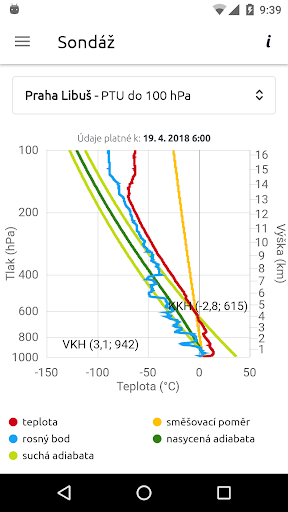
He drew Displays data obtained balloon probes discharged in Prague - Libuš.
Shows the change of temperature, dew point, wind speed and direction depending on the height.
They are displayed as dry saturated adiabat curve and the mixing ratios.
The predictions of the model Aladin Aladin model provides forecasts of basic meteorological values for the entire territory of the Czech Republic with a resolution of 1 km.
The data are displayed on maps and can be run as animation in time.
Displayed as temperature, rainfall, wind speed and direction, cloud cover, relative humidity, ventilation index and pressure.
UV Index UV index expresses the intensity of the suns ultraviolet radiation and its effects on human skin.
It displays the UV index and short instructions how when the intensity of the suns UV rays act.
It is also possible to enable the conversion of UV Index for a stay on the snow (the reflection from the snow cover increased UV index 1.2x).
Status waters The map indicates the position of the Czech Republic about 350 gauging stations.
In detail, the stations history, level measurement, flow and water temperatures for the last two days with a time resolution of 10 minutes.
Turn the mobile landscape data can be displayed graphically.
For stations that provide weather can also see a graph of the predicted water level or flow in the next two days.The selected profile can enable notifications exceeded degrees of flood activity or self-monitoring threshold level.
The risk of flash floods Map CR are the territory of individual municipalities with extended powers, color-coded according to the current risk of flash floods.
There is also a map of soil water saturation.
High saturation area presents in the case of larger precipitation increased risk of flash floods or local flooding.Another risk map shows rainfall for 1, 3 or 6 hours, during which achieve at risk of flash floods or local flooding.
Air pollution The map indicates the position of the Czech Republic about 150 automated air pollution monitoring stations.
Brands are colored by the air quality index.
In detail, the values of the selected station station of pollutants measured in hours for the last day.
Turn the mobile landscape data can be displayed graphically.
The collected data are: particulate matter (PM 10), sulfur dioxide (SO2), nitrogen dioxide (NO2) and ozone (O3).On the other maps are graphically displayed concentrations of these pollutants throughout the country.
Gaming Features
Enjoy immersive gaming experience with various game modes.
Weather Features
Get accurate weather forecasts and real-time updates.
Food & Dining
Discover recipes and order food from your favorite restaurants.
See the ČHMÚ+ in Action

Get the App Today
Available for Android 8.0 and above